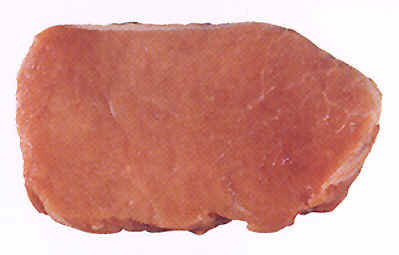
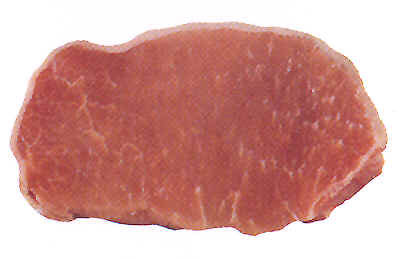
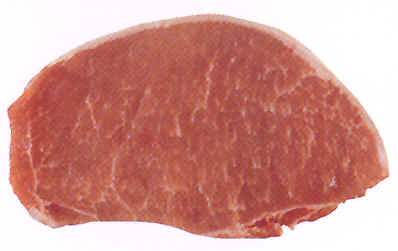
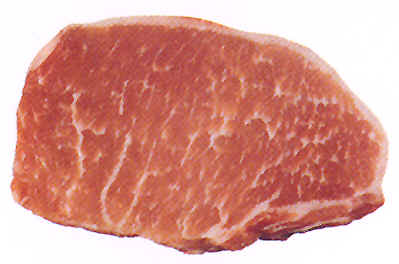
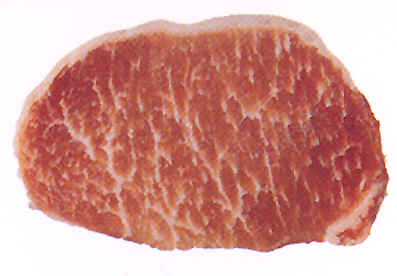
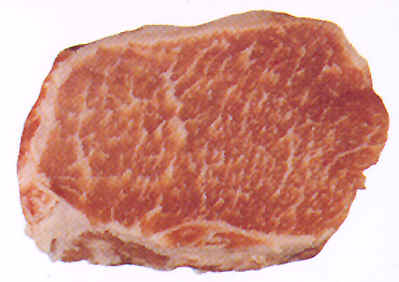
| Marbling Standards | |||
 |
 |
 |
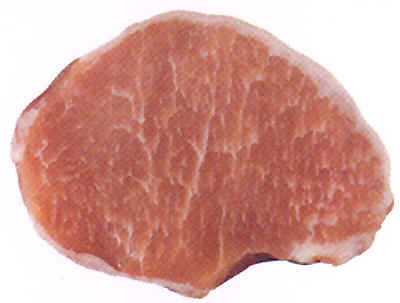 |
| 1.0 | 2.0 | 3.0 | 4.0 |
| Marbling Standards | |||
|
|
|
|
| 1.0 | 2.0 | 3.0 | 4.0 |
 |
 |
 |
| 5.0 | 6.0 | 10.0 |
| The quality of fresh pork varies greatly. The quality levels shown above will appear differently to chefs and consumers, taste differently when cooked, and perform differently when converted to processed products. High quality pork has greater monetary value than low quality pork. Quality can be evaluated by simply visual appraisal, or it can be determined more accurately by scientific tests. This chart may be used to help identify variations in pork quality. | |
|
Marbling scores correspond to intramuscular lipid content |
Information
supplied
by
|